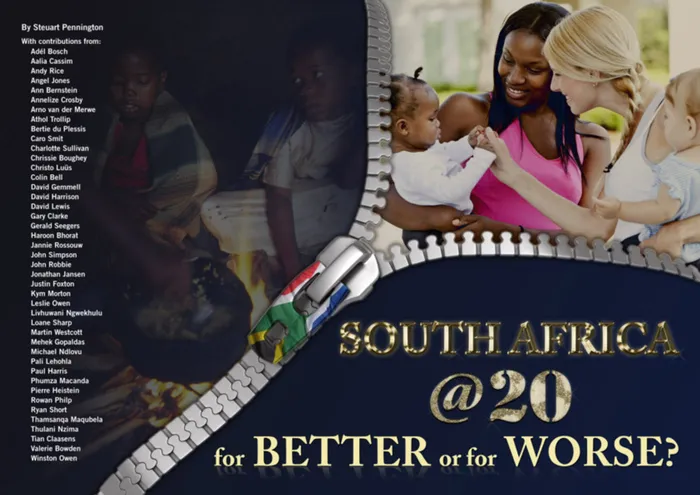
The book South Africa @ 20 " for better or for worse takes a fresh look at our country 20 years after the fall of apartheid. The book South Africa @ 20 " for better or for worse takes a fresh look at our country 20 years after the fall of apartheid.
One of the more important psychological research experiments was that carried out by Philip Zimbardo a professor of Psychology at Stanford University in Palo Alto, California, in 1970.
He wanted to find out the extent to which the environment, the situation in which we find ourselves, affects our beliefs, attitudes and behaviour.
He turned the university’s Psychology Department into four prison cells. Twelve volunteers were imprisoned, and 12 volunteers became prison guards.
Zimbardo recorded what took place. Within two days the prison guards became tough, hard, stereotypical guards. The prisoners became prisoners in behaviour and attitude.
On the first night the prisoners rioted. The guards brutally attacked them with fire extinguishers. They locked the leader of the prisoners in the broom cupboard. They stripped the prisoners naked and made them do press ups.
Remember, the prisoners were all volunteers. They could leave the experiment at any time they wanted. None did so. They remained and became “real” prisoners. They believed they were prisoners.
The guards believed they were guards. The experiment was scheduled to run for two weeks. Zimbardo stopped it after six days – he had to.
Zimbardo had shown that the environment in which we live directly affected our belief system, our attitudes and our behaviour.
Fast forward to South Africa today. Many influential and prominent leaders regularly make the following observations: “South Africa is an unsafe destination for tourists”; “South Africa is the most unequal society in the world”; “More than 25 percent of South Africans are unemployed”.
Not only do ordinary South Africans hear and read these statements – they become part of our narrative, and we believe them to be true.
Important decisions, business and personal, are made in this context. The consequences have become part of our reality: people become dissatisfied; international rating agencies downgrade us; the rand weakens; workers became restless; ordinary South Africans become gloomier.
The difficulty for us as South Africans is that we simply accept statements made by those in leadership positions as “the truth”. Like Zimbardo’s prisoners and prison guards, we begin to think and behave as if we are the most unequal society in the world.
We do not doubt or even question the validity of such statements, particularly if they are said by people with prestige and status.
Steuart Pennington and I believe that there are at least 24 myths in South Africa which need to be addressed. We need a voice of reason if we are to operate in a stable, peaceful society with a solid investment reputation.
As David McRaney writes in his book You are not so Smart: “If you feel more inclined to believe something is true because it comes from a person with prestige, you are letting the argument from authority spin your head.
“If something is controversial, it usually means there are many experts who disagree. You would be wise to come to your own conclusions, based on the evidence, not the people delivering it”.
Consider two issues which are commonly held to be true: increasing levels of inequality and our unemployment levels. The basis for describing SA as the most unequal country in the world is determined by the Gini Coefficient.
This is the international standard for measuring the distribution of income in a country. Information on the Gini Coefficient can be found at www.data.worldbank.org
The Gini Coefficient measures the distribution of something among a number of people. The higher the Gini Coefficient, the greater the inequality. Simply put, a figure of .01 shows a high level of equality whilst .99 shows a high level of inequality.
The World Bank has a schedule where it publishes the Gini Coefficient of all countries, provided it receives the information. South Africa has a figure of 0.63. But look at the website carefully. The last figure for South Africa is for 2009.
Count the number of countries that show their figures for 2009. You will see there are 41 countries. We could conclude then that in 2009, out of the 41 countries for which the World Bank has figures, South Africa has the highest Gini Coefficient out of the 41.
There are between 195 and 250 countries in the world (depending on how one defines a “country”), 193 of which are members of the UN.
As Steuart Pennington writes in his book, South Africa @ 20 – for better or for worse: “The Gini Coefficient for 170 countries is known, for 60 it is not. Most countries last disclosed their Gini Coefficient in 2007”.
In 2009 ± 11 million South Africans received a government grant. By 2012 this had increased to 16 million. This will have a direct bearing on the input figures determining the Gini Coefficient.
I understand that government grants are not normally included in the calculation of the Gini Coefficient. SA is one of the countries spending the largest part of our GDP on social grants and social assistance i.e. 3.2 percent. Only Norway, Sweden and Denmark spend more, at 4.2 percent and 4.4 percent.
Taking the provision of social grants, free water, free sanitation and free electricity, and by allowing for personal income tax, our Gini Coefficient drops to 0.59.
This puts us almost bang in the middle of the 41 countries! Here are the two parts of the formulae for calculating the Gini Coefficient.
The formulae are quite difficult to understand and to apply. And like any mathematical equation – if any of the input figures are wrong, the answer will be wrong.
For an explanation, see http://www3.nccu.edu.tw/~jthuang/Gini.pdf
In 2010 the SARS amnesty for businesses that were not registered as taxpayers resulted in close to 385 000 businesses coming forward and registering. Think about this!
It means that 385 000 individuals were operating businesses and earning money that the state did not know about.
Even if one additional person worked in that business, our unemployment figures would be wrong by 385 000 x 2 people = 770 000. Perhaps this implies that 770 000 people were reflected in the Gini Coefficient calculations as earning no income.
There are several research institutions which cast doubt on our unemployment figures. Essentially these institutions maintain that the “grey” area of our economy employs many more people than our official figures reveal.
Their figures show a much higher number of people unemployed in the informal sector of our economy. Our real unemployment rate may be as low as 13 percent.
See, for example, the Adcorp website and Labour Market Navigator’s website and compare their figures to Stats South Africa’s figures. Think about car guards, caddies at our 400 golf courses, waiters, illegal miners, etc.
The reality is we are actually not sure of the exact figures.
Let’s look at the statement “South Africa is an unsafe destination for tourists”. As Pennington writes: “At the end of 2009, the British Foreign and Commonwealth Office found that British visitors were far less likely to be victims of rape or murder in SA than in Spain, Egypt or even Italy.
“Looking at both the 212 000 British residents and the 451 580 visitors in that year, 2009, the department found a total of 48 British deaths in SA, including accidents and natural causes. By contrast, there were 288 deaths in Thailand – with a similar total British presence; 62 in Canada; 102 in Turkey; and 123 in India.
“There were zero rapes or sexual assaults recorded for Britons in SA that year, compared to 34 in Egypt; 36 in Turkey; and 9 in France.”
I know it’s difficult to accept these figures. Why? – because Zimbardo was right. What we hear, what we read, what we are shown on TV directly affects our thinking and our beliefs.
Indeed, we are like Zimbardo’s prisoners.
Perhaps we need to be a bit more sceptical about comments, statements and conclusions from figures which are suspect.
Perhaps we should believe Lord Courtney when he referred to “lies – damn lies – and statistics”.
Or perhaps we should remain as metaphorical prisoners of Zimbardo’s experiment.
* Owen is a part-time lecturer at the Graduate School of Business at the University of KwaZulu-Natal. He has worked with Steuart Pennington producing the book, “South Africa @ 20: For Better or For Worse” published by SA The Good News. The views contained here are his own.